Visualise Interesting Sorting Algorithms With Python
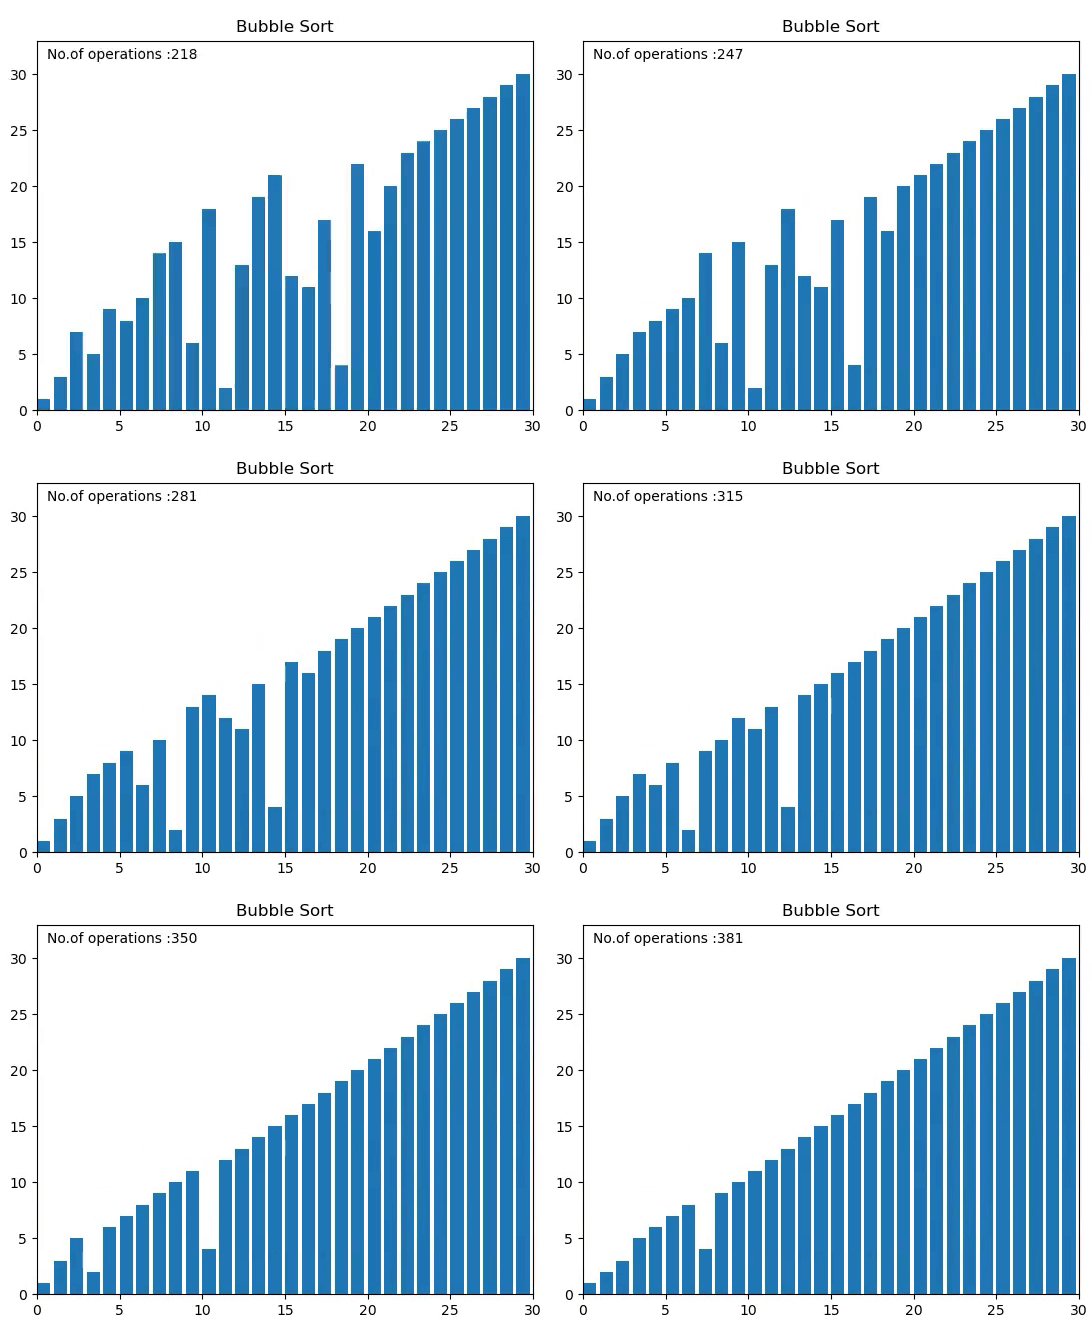
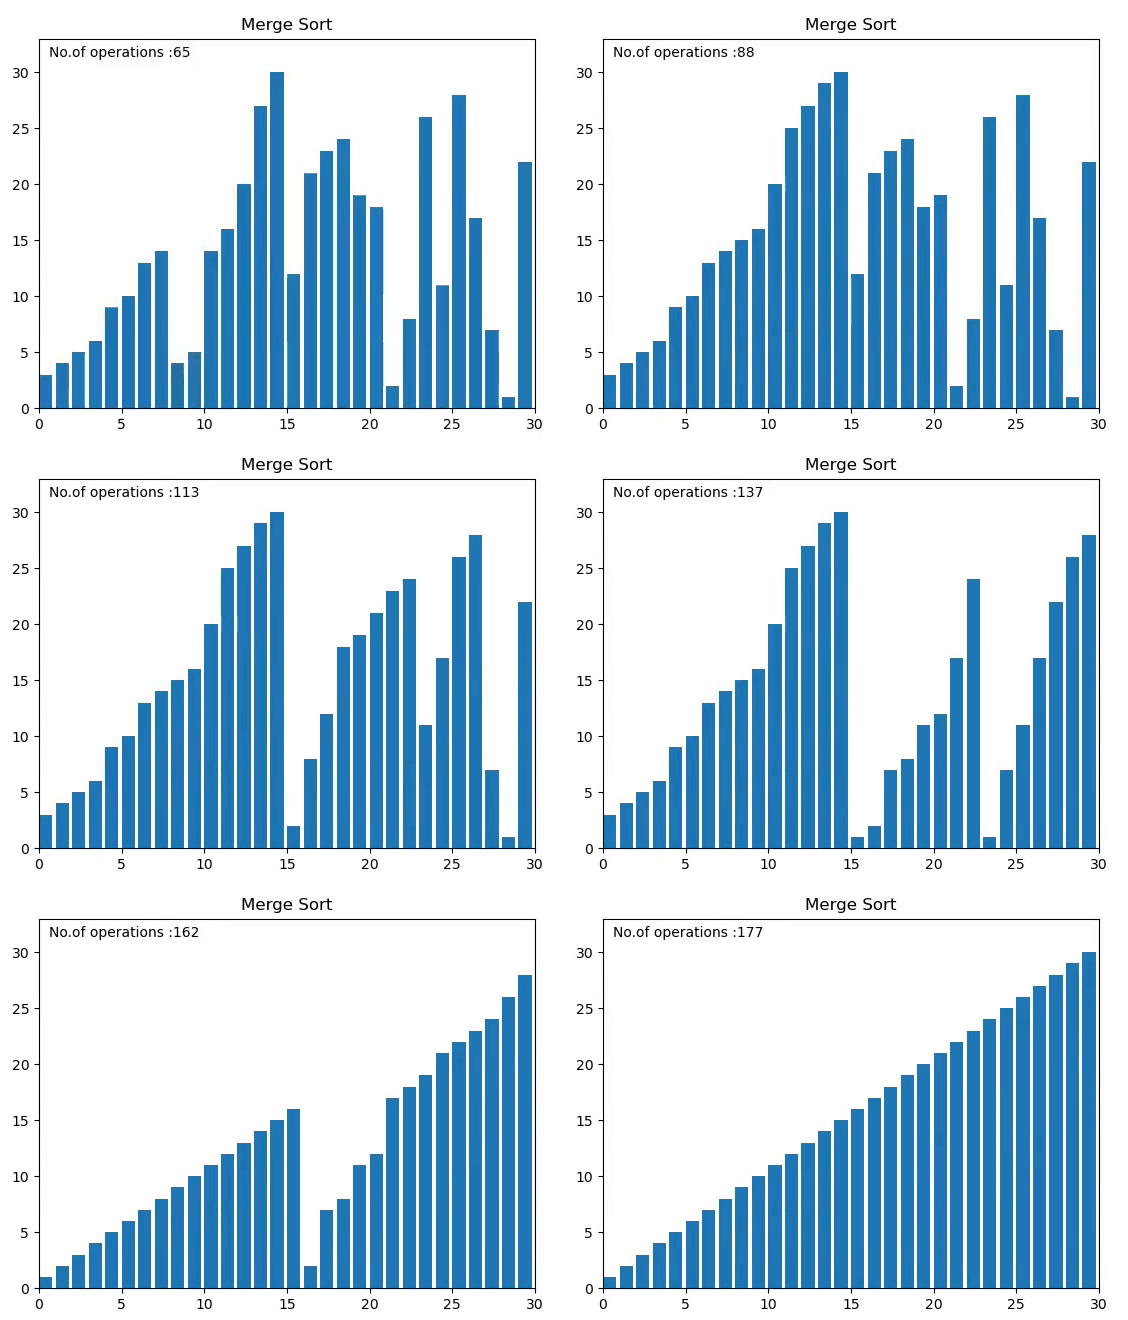
There are various types of sorting algorithms out there and sometimes it becomes very difficult to understand their internal working without visualization. Hence I decided to visualize these sorting algorithms in python with the help of matplotlib.animations library.
 |
 |
NOTE:- In this article, we will also compute the number of operations performed and will be able to see the time complexity of the sorting algorithm.
As our purpose is to only visualize the sorting algorithms hence I will be using the merge sort for demonstration but you should implement the rest of them in order to understand the differences among them.
Before we start coding, you must have python 3.3 or above installed because I have used the yield from feature or generator.
Let’s Start:-
Firstly you need to import the given libraries. We have used the random module in order to generate a random array of numbers to be sorted. The matplotlib pyplot and animation modules will be used to animate the sorting algorithm.
import random
import matplotlib.pyplot as plt
import matplotlib.animation as anim
Below given swap function will be used to swap the elements in the given array. Defining a separate function is useful as it will be used exhaustively throughout different algos.
def swap(A, i, j):
    a = A[j]
    A[j] = A[i]
    A[i] = a
    # also in python A[i],A[j]=A[j],A[i]
We have used Merge Sort to demonstrate this visualization because this is the most popular and one of the best sorting algorithm out there. Merge sort follows Divide and Conquer technique for sorting. It divides the array into two subarrays and each of these is sorted by calling the merge sort recursively on them. Our main focus is to visualize the algorithm hence I will not explain the working of it. The following code shows the merge sort. In order to get the intuition on how it works, one can follow this video on youtube jenny’s lecture .
def merge_sort(arr,lb,ub):
    if(ub<=lb):
        return
    elif(lb<ub):
        mid =(lb+ub)//2
        yield from merge_sort(arr,lb,mid)
        yield from merge_sort(arr,mid+1,ub)
        yield from merge(arr,lb,mid,ub)
        yield arrdef merge(arr,lb,mid,ub):
    new = []
    i = lb
    j = mid+1
    while(i<=mid and j<=ub):
        if(arr[i]<arr[j]):
            new.append(arr[i])
            i+=1
        else:
            new.append(arr[j])
            j+=1
    if(i>mid):
        while(j<=ub):
            new.append(arr[j])
            j+=1
    else:
        while(i<=mid):
            new.append(arr[i])
            i+=1
    for i,val in enumerate(new):
        arr[lb+i] = val
        yield arr
Now we will simply create the random list of numbers to be sorted and the length of the array will be decided by the user itself. After that,if condition is used to choose the algorithm.
n = int(input("Enter the number of elements:"))
al = int(input("Choose algorithm:  1.Bubble \n 2.Insertion \n 3.Quick \n 4.Selection \n 5.Merge Sort))
array = [i + 1 for i in range(n)]
random.shuffle(array)if(al==1):
    title = "Bubble Sort"
    algo = sort_buble(array)
elif(al==2):
    title = "Insertion Sort"
    algo = insertion_sort(array)
elif(al==3):
    title = "Quick Sort"
    algo = quick_Sort(array,0,n-1)
elif(al==4):
    title="Selection Sort"
    algo = selection_sort(array)
elif (al == 5):
    title = "Merge Sort"
    algo=merge_sort(array,0,n-1)
Now we will create a canvas for the animation using matplotlib figure and axis. Then we have created the bar plot in which each bar will represent one number of the array. Here text() is used to show the number of operations on the canvas. The first two arguments are the position of the label.transform=ax.transAxes tells that the first two arguments are the axis fractions, not data coordinates.
fig, ax = plt.subplots()
ax.set_title(title)
bar_rec = ax.bar(range(len(array)), array, align='edge')
text = ax.text(0.02, 0.95, "", transform=ax.transAxes)
The update_plot function is used to update the figure for each frame of our animation. Actually, this function will pass to anima.FuncAnimamtion() that uses it to update the plot. Here we have passed the input array, rec which is defined above, and the epochs that keep the track of number of operations performed. One may think that we can simply use integer value instead of a list in epochs but integer like epoch = 0 cannot be passed by reference but only by value, unlike a list, which is passed by reference. The set_height() is used to update height of each bar.
epochs = [0]
def update_plot(array, rec, epochs):
    for rec, val in zip(rec, array):
        rec.set_height(val)
    epochs[0]+= 1
    text.set_text("No.of operations :{}".format(epochs[0]))
In the end, we create anima object in which we pass frames=algo that takes generator function(algo is generator function as it contains yield ) and after that, it passes the generated or updated array to the update_plot ,fargs takes additional arguments i.e. epochs and bar_rec and interval is the delay between each frame in milliseconds.
And finally, we use plt.show() to plot the animated figure.
anima = anim.FuncAnimation(fig, func=update_plot, fargs=(bar_rec, epochs), frames=algo, interval=1, repeat=False)
plt.show()
Full code with all sorting algorithms is available in my Github repo. Check it out.
And if you like this article, please let me know.
Learn more about animationFunction